1
2
3
4
5
6
7
8
9
10
11
12
13
14
15
16
17
18
19
20
21
22
23
24
25
26
27
28
29
30
31
32
33
34
35
36
37
38
39
40
41
42
43
44
45
46
47
48
49
50
51
52
53
54
55
56
57
58
59
60
61
62
63
64
65
66
67
68
69
70
71
72
73
74
75
76
77
78
79
80
81
82
83
84
85
86
87
88
89
90
91
92
93
94
95
96
97
98
99
100
101
102
103
104
105
106
107
108
109
110
111
112
113
114
115
116
117
118
119
120
121
122
123
124
125
126
127
128
129
130
131
132
133
134
135
136
137
138
139
140
| import numpy as np
import operator
import matplotlib.pyplot as plt
from sklearn.metrics import confusion_matrix, precision_recall_fscore_support, roc_curve, auc, precision_recall_curve, average_precision_score
from sklearn.preprocessing import label_binarize
def classify0(in_x, data_set, labels, k):
"""KNN 分类器:返回预测标签与邻居投票统计。"""
data_set_size = data_set.shape[0]
diff_mat = np.tile(in_x, (data_set_size, 1)) - data_set
distances = (diff_mat**2).sum(axis=1) ** 0.5
sorted_idx = distances.argsort()
votes = {}
for i in range(k):
lab = labels[sorted_idx[i]]
votes[lab] = votes.get(lab, 0) + 1
pred = sorted(votes.items(), key=operator.itemgetter(1), reverse=True)[0][0]
return pred, votes
def file2matrix(filename):
    """从文件读取数据并转为矩阵与标签。"""
    with open(filename) as fr:
        lines = fr.readlines()
    m = len(lines)
    data = np.zeros((m, 3))
    labels = []
    for i, line in enumerate(lines):
        parts = line.strip().split('\t')
        data[i, :] = parts[0:3]
        labels.append(parts[-1])
    return data, labels
def auto_norm(data_set):
    """按列做 min-max 归一化。"""
    min_vals = data_set.min(0)
    max_vals = data_set.max(0)
    ranges = max_vals - min_vals
    m = data_set.shape[0]
    norm = (data_set - np.tile(min_vals, (m, 1))) / np.tile(ranges, (m, 1))
    return norm, ranges, min_vals
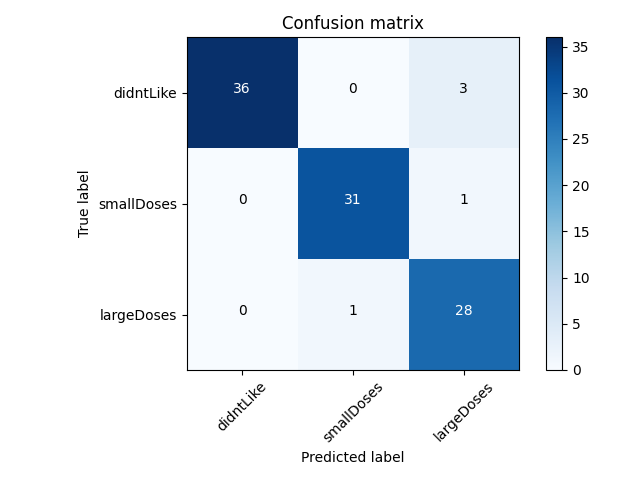
def plot_confusion_matrix(y_true, y_pred, classes, title='Confusion matrix', cmap=plt.cm.Blues):
cm = confusion_matrix(y_true, y_pred)
plt.imshow(cm, interpolation='nearest', cmap=cmap)
plt.title(title)
plt.colorbar()
ticks = np.arange(len(classes))
plt.xticks(ticks, classes, rotation=45)
plt.yticks(ticks, classes)
fmt = 'd'
thresh = cm.max() / 2.0
for i, j in np.ndindex(cm.shape):
plt.text(j, i, format(cm[i, j], fmt),
ha="center", color="white" if cm[i, j] > thresh else "black")
plt.ylabel('True label')
plt.xlabel('Predicted label')
plt.tight_layout()
plt.savefig('confusion_matrix.png')
plt.close()
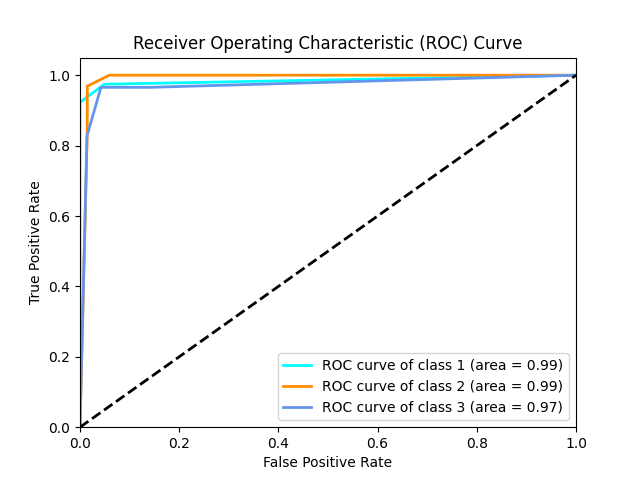
def plot_roc_curve(y_true, y_scores, classes):
y_true_bin = label_binarize(y_true, classes=np.unique(y_true))
n_classes = y_true_bin.shape[1]
fpr, tpr, roc_auc = {}, {}, {}
for i in range(n_classes):
fpr[i], tpr[i], _ = roc_curve(y_true_bin[:, i], y_scores[:, i])
roc_auc[i] = auc(fpr[i], tpr[i])
plt.figure()
colors = ['aqua', 'darkorange', 'cornflowerblue']
for i, color in zip(range(n_classes), colors):
plt.plot(fpr[i], tpr[i], color=color, lw=2,
label=f'ROC curve of class {i+1} (area = {roc_auc[i]:0.2f})')
plt.plot([0, 1], [0, 1], 'k--', lw=2)
plt.xlim([0.0, 1.0]); plt.ylim([0.0, 1.05])
plt.xlabel('False Positive Rate'); plt.ylabel('True Positive Rate')
plt.title('Receiver Operating Characteristic (ROC) Curve')
plt.legend(loc="lower right")
plt.savefig('roc_curve.png')
plt.close()
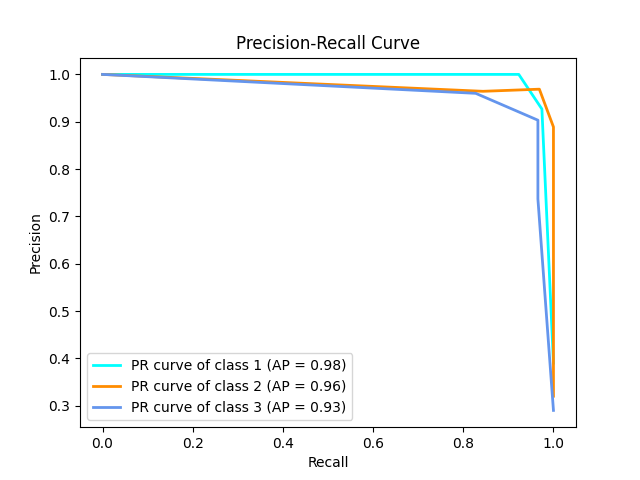
def plot_pr_curve(y_true, y_scores, classes):
y_true_bin = label_binarize(y_true, classes=np.unique(y_true))
n_classes = y_true_bin.shape[1]
precision, recall, ap = {}, {}, {}
for i in range(n_classes):
precision[i], recall[i], _ = precision_recall_curve(y_true_bin[:, i], y_scores[:, i])
ap[i] = average_precision_score(y_true_bin[:, i], y_scores[:, i])
plt.figure()
colors = ['aqua', 'darkorange', 'cornflowerblue']
for i, color in zip(range(n_classes), colors):
plt.plot(recall[i], precision[i], color=color, lw=2,
label=f'PR curve of class {i+1} (AP = {ap[i]:0.2f})')
plt.xlabel('Recall'); plt.ylabel('Precision'); plt.title('Precision-Recall Curve')
plt.legend(loc="lower left")
plt.savefig('pr_curve.png')
plt.close()
def dating_class_test():
"""主流程:加载数据 -> 归一化 -> 拆分 -> 预测 -> 评估与可视化。"""
ho_ratio = 0.10
data_raw, label_str = file2matrix('datingTestSet.txt')
label_map = {'didntLike': 1, 'smallDoses': 2, 'largeDoses': 3}
labels = [label_map[x] for x in label_str]
data_norm, ranges, min_vals = auto_norm(data_raw)
m = data_norm.shape[0]
n_test = int(m * ho_ratio)
train_x = data_norm[n_test:, :]
train_y = labels[n_test:]
test_x = data_norm[:n_test, :]
test_y = labels[:n_test]
k = 3
preds, scores = [], []
for i in range(n_test):
pred, vote = classify0(test_x[i, :], train_x, train_y, k)
preds.append(pred)
s = np.zeros(len(label_map))
for lab, cnt in vote.items():
s[lab - 1] = cnt / k
scores.append(s)
scores = np.array(scores)
err = (np.array(preds) != np.array(test_y)).sum()
acc = 1 - err / float(n_test)
print(f"Accuracy: {acc:.2f}")
precision, recall, f1, _ = precision_recall_fscore_support(test_y, preds, average='macro')
print(f"Precision: {precision:.2f}, Recall: {recall:.2f}, F1-Score: {f1:.2f}")
class_names = list(label_map.keys())
plot_confusion_matrix(test_y, preds, classes=class_names)
plot_roc_curve(test_y, scores, classes=np.unique(labels))
plot_pr_curve(test_y, scores, classes=np.unique(labels))
print("评估图表 (confusion_matrix.png, roc_curve.png, pr_curve.png) 已保存。")
if __name__ == '__main__':
dating_class_test()
|